KYLE. LEWIS.
The Seattle Mariners love their Kyles, be it Kyle Lewis, Kyle Seager, or, former M, Austin Kyle Nola. Kyle Lewis, Jerry Dipoto’s first draft pick as GM, has finally paid dividends for a blue-chip prospect who fought back from a freakish knee injury that set back his development.
After a surprising start out of the gate as a September call up in 2019, Lewis’ formal 2020 rookie season culminated in the AL Rookie of the Year Award. While certainly merited, Mariners fans and baseball fans alike noticed a considerable drop in Lewis’ performance occurring roughly halfway through the 2020 season.
The below figure uses a variant of Marchi et al.’s rolling average function. Instead of at bats, however, I’ve substituted games. The figure below aggregates Lewis’ rolling average over 21 game spans (so three weeks, game 1–21, 2–22, 3–23 etc.). The vertical line represents Lewis’ season batting average. Of course, batting average has its drawbacks but for these purposes I think it demonstrates the course of the season well.

To the surprise of no Mariner fan, Lewis started the season unsustainably hot and continued on a downward trend dipping under what would be his season average (the horizontal line). Around August 15, however, Lewis begins to pick it up — his peak is higher than it was at the beginning of the season, peaking on August 19. But again this proved to be unsustainable and production (at least in terms of batting average) falls off a cliff after that peak, effectively performing below his season average from the end of August on.
The below figure plots Lewis’ OPS (top figure) and wOBA (bottom) per game using Fangraphs data. Horizontal lines again represent Lewis’ season average and the vertical represents the game in which his three-week rolling averaged peaked (when the Mariners made a trip to LAD, if you’re curious). Again, we see patterns similar to the above figure with both his OPS and wOBA values tailing off in the latter part of the season.

This got me thinking: what the hell happened?
I was first curious about pitch-type and I leveraged Baseball Savant data to observe each pitch thrown to Lewis. I then divided the dataset into two period: before August 29 and after August 29 — roughly, the pre-slump and slump periods.
I calculated the number of each pitch Lewis saw before and after the identified dates. So keep in mind this is all pitches thrown, regardless of output. That is, it doesn’t differentiate between hit, strike, ball, etc.

There are, evidently, considerable changes in the type of pitches that Lewis saw in pre- and post-decline periods. After the three-weak peak just prior to the two-game set in LA, pitchers started ramping up their fastballs, changeups, and sinkers thrown to Lewis while considerably decreasing the number of sliders thrown. The difference in total pitches regarding curves and cutters are marginal and not every pitcher has a knuckle-curve or splitter in their arsenal.
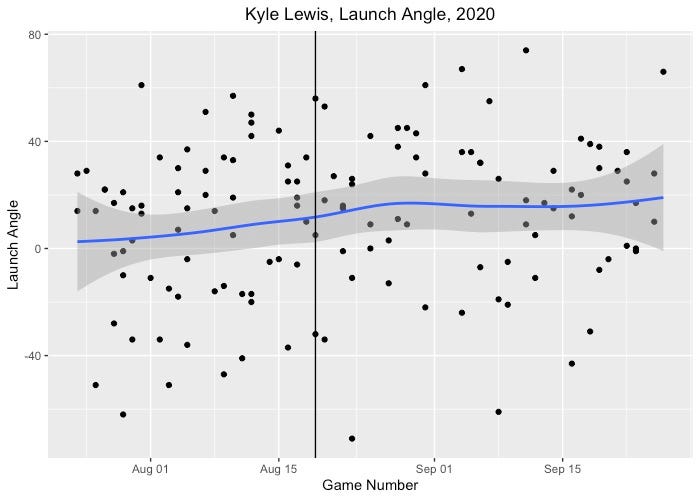
I don’t really offer a definitive take on why Lewis’ production fell off over the second-half of the season, I only suggest that maybe it’s a result of being a professional neophyte. Unsustainable levels of production are bound to taper off. More interestingly I think, however, are cross-season changes in launch-angle on balls in play. The below figure plots Lewis’ launch angle on all balls in play across the season. Lewis’ mean launch angle was 11.1 degrees with a standard deviation of 29. The figure demonstrates that Lewis’ launch angle rose as the season wore on. In fact, Lewis averaged a pre-decline launch angle of 6.92 and a decline period average of 14.81 (p < 0.11) indicating that Lewis’ launch angle on BIP was, in fact, rising as the season went on. Indeed, 21% of his balls in play before his peak were flyballs or popups, this number increased to 36% in the post-peak period.
The reality is, sure, Lewis’ performance did decline over the 2020 season but I’m reticent to make bold claims about an incoming weak 2021 season. He was a rookie, his launch angle increased over the season causing more fly balls, and pitchers ramped up their fastballs and changeups. I offer no real predictions here beyond simple descriptions of what occurred in 2020, but I don’t see why Lewis can’t get this under control over 2021. And given that 2020 was a small sample, robbing Lewis of a full season, it will be interesting to see if, in a longer time frame, Lewis can make adjustments in the middle of a season.
I think to make bolder claims, I’ll need to do more research on launch angle, compare it with league trends, and see the divergences. These kinds of steps are what I’m planning to do in my off time (because I lead a super exciting life).
If anyone reads this, let me know if there’s any questions you’ve had. Mariners or non-Mariners related. I’m always happy to steal your ideas.